Mohammad KeyhaniInteractive keynote
Vibe Coding the Future: Software Entrepreneurship After Generative AI
Mohammad Keyhani. A presentation that is itself software: 14 scenes, live seeded simulations, and the full argument in readable form below.
Selected for stage: 14 of 14 slides · estimated 17:30 (minutes:seconds).
Stage keys: click the slide, → / Space / Page Down to reveal; ← / Page Up to go back; O for overview; P to pause; R to replay; F for fullscreen; Escape to return. Notes and elapsed timer are opt-in and appear on the same screen when enabled.
Clickers using Page Down / Page Up work even when a control is focused. Arrow keys remain available for editing focused inputs.
Mohammad Keyhani
Vibe Coding the Future: Software Entrepreneurship After Generative AI
- This presentation is software.
In short: A coded keynote about making better entrepreneurial experiments. Mohammad Keyhani is a Replit-certified Level 4 Advanced Builder and ranks in the Top 1% of Replit Agent users, as displayed on AIDrivenSites.com.

Speaker narrative · cue: Ask for a show of hands. At 00:30 reveal that this presentation is software, alongside the Level 4 and Top 1% Replit credentials. Move on at 01:00.
What would you build if the distance between an idea and a working piece of software became much shorter? Keep one answer in mind. Perhaps it is a problem you know from your industry, your workplace, or a customer conversation. The interesting question is not whether an AI can produce a convincing screen. It is what you would do next. I am Mohammad Keyhani. I study entrepreneurship and digital innovation, and I build with these tools. This talk is called Vibe Coding the Future: Software Entrepreneurship After Generative AI. My projects raise a question: why try more things now, and what would make that a sensible portfolio? There is something different about the slides today. This presentation is itself software. I am a Replit-certified Level 4 Advanced Builder and in the top one percent of Replit Agent users. These are the credentials I share on AIDrivenSites.com. We will change assumptions, draw outcomes, and compare different patterns of bets. Nothing here needs a live AI service to perform on cue. My argument is simple: cheaper building creates an opportunity for better experiments. It does not create customers automatically. The advantage belongs to people who test something meaningful, make genuinely different bets, exercise judgment, and survive long enough to find demand. Keep your idea in mind as we explore what that requires.
From waiting for a team to making a start
Software entrepreneurship is faster, cheaper, and more feasible now for more people than ever before
GenAI makes the whole entrepreneurial journey easier to attempt.
- Research. Pitch. Build. Launch. Operate.
- Fewer steps have to wait for someone else.
In short: GenAI can make the full entrepreneurship journey easier and faster: researching problems, shaping offers, creating prototypes, preparing outreach, launching and handling operating work. The supplied NoCodeDevs tweet and silent crowd clip illustrate the difficulty of recruiting technical help around an idea. More of the founder’s next steps can now begin without waiting for a complete team. The meme is an illustration, not an empirical measure of hiring or venture performance. Engineering expertise, human judgment and real customer demand remain important.
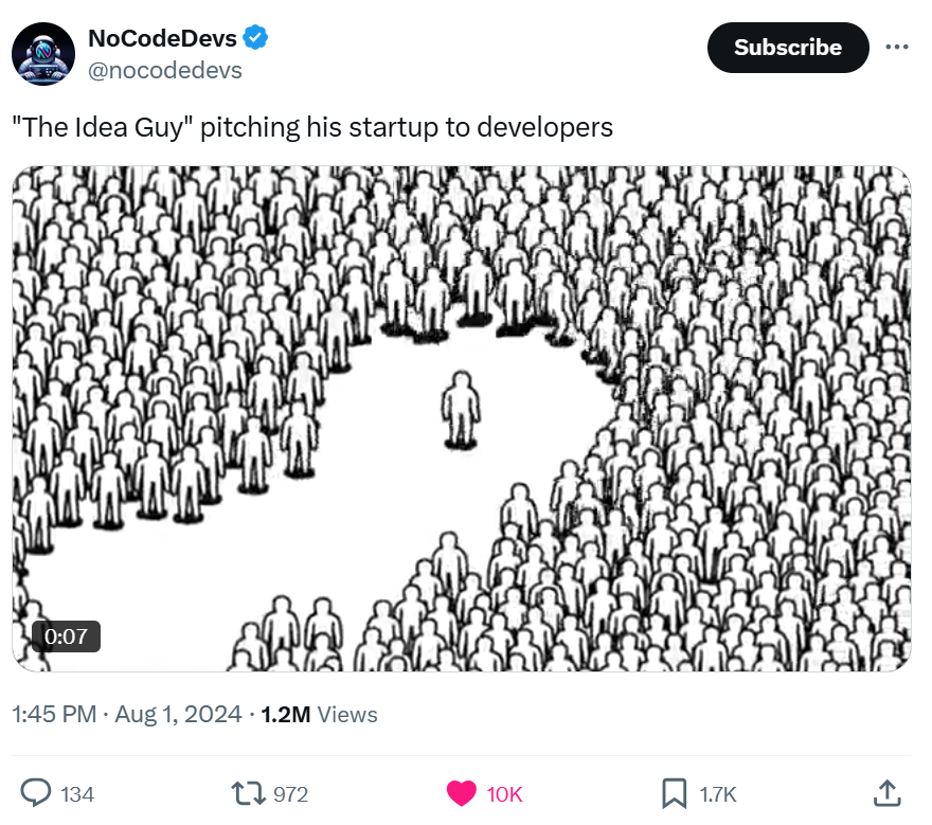

Speaker narrative · cue: 60s. Let the supplied tweet and silent loop make the technical co-founder bottleneck tangible. Broaden the point to research, pitching, building, launch and operations. Transition to the small-bets movement.
Here is a familiar frustration: you have an idea, but you need somebody else to build it. The NoCodeDevs meme captures the awkwardness of pitching developers on joining your startup. I have called this the tyranny of the technical co-founder. GenAI changes how much of an entrepreneurial journey can start before you have recruited a team. The change reaches beyond writing code. You can research a customer problem, clarify an offer, draft a pitch, design a landing page, build a prototype, prepare outreach and automate parts of ongoing operations. More of the whole process becomes easier and faster to attempt. Engineering expertise still matters for reliability, security and scale. Customers still decide whether the offer is useful. But fewer early steps must remain on hold while you wait for a complete team. This greater freedom to act is one reason the small-bets approach resonates with me.
Lower experiment costs · the small-bets movement
You can just build things.
Build fast. Automate. Make room for the next experiment.
- Daniel Vassallo leads the Small Bets community.
- Pieter Levels: build fast → automate → next experiment.
In short: Lower implementation costs let indie entrepreneurs turn more ideas into working products. Daniel Vassallo leads the Small Bets community; Pieter Levels exemplifies the approach of building fast, automating products and operations, and moving to another experiment. These practices motivate Keyhani’s research and portfolio. His Infinite Slop classroom composite illustrates speed: he describes an idea post on August 29, 2026 and a build announcement a few hours later. The composite supports a teaching example of rapid building; it does not independently verify timestamps or document all operational automation. Levels and Vassallo have much stronger distribution than Keyhani.
Idea to public demo, in hours
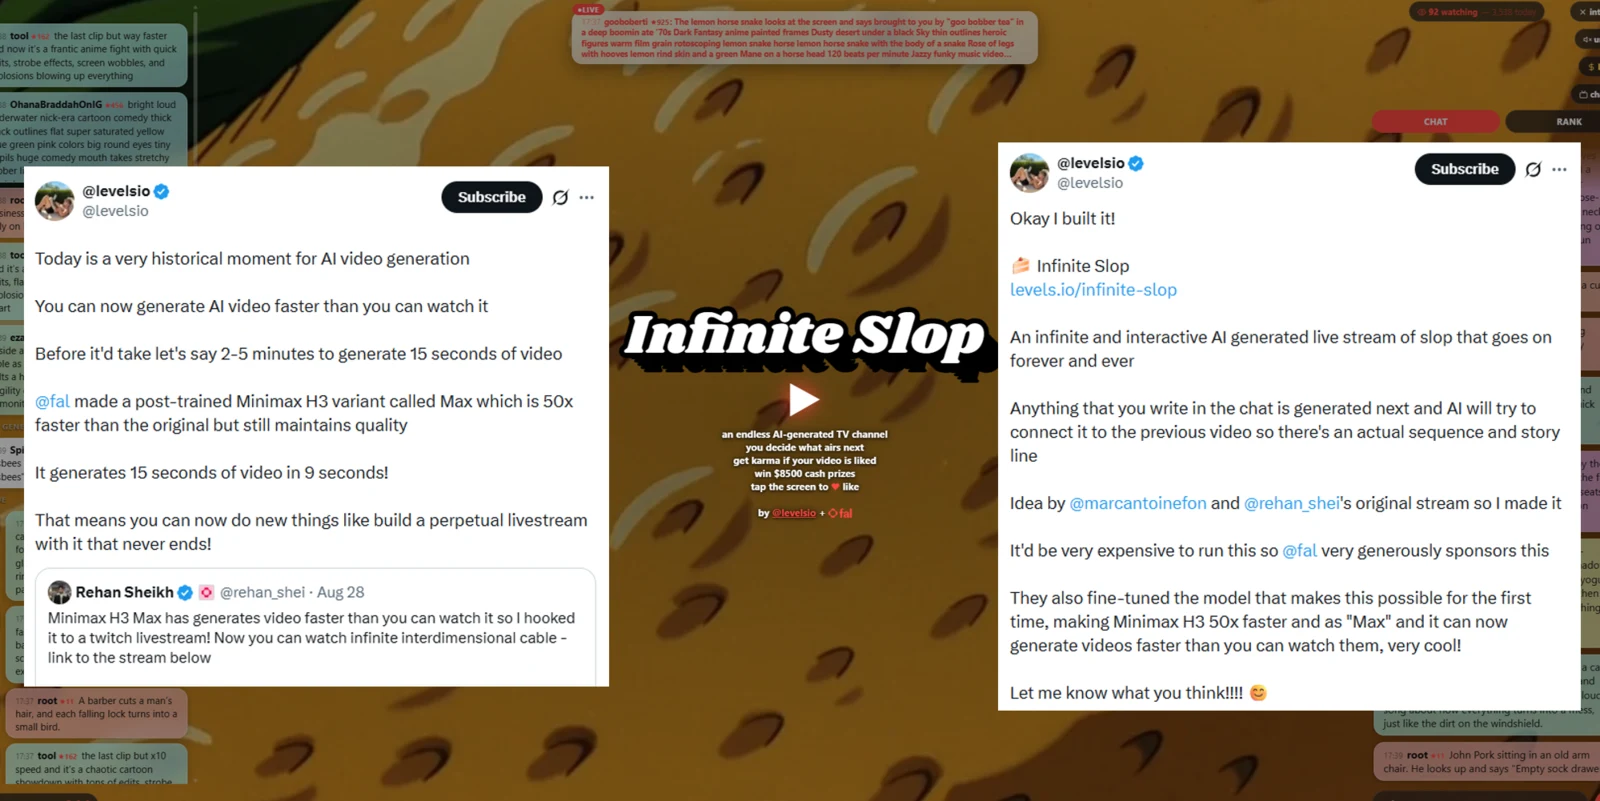
- SparkSees another builder’s livestream experiment
- HoursBuilds his own version the same day
- ApproachAutomate, then start the next experiment
Speaker narrative · cue: Use Infinite Slop to make fast building tangible. Introduce Vassallo’s Small Bets community and Levels as its poster child in practice. Emphasize automation freeing capacity for another experiment, then transition to SchoolStats.
You can just build things. GenAI lowers the cost of turning an idea into working software, making it practical to try ideas that once stayed on a list. That connects with the indie entrepreneurship movement around small bets. Daniel Vassallo leads the Small Bets community: keep experiments affordable and make room for several attempts. Pieter Levels is the poster child for this approach. Build fast, automate the product and its operations, then move to the next experiment. Automation matters: each project should free capacity rather than become another full-time job. The Infinite Slop image illustrates his speed. I describe the idea and build posts as a few hours apart on August twenty-ninth, twenty twenty-six. The image shows the build announcement; the automation point describes his wider approach. These practices motivate my research and my portfolio. Pieter and Daniel have much stronger distribution than I do. Next, my own SchoolStats.ca example.
My experience · SchoolStats.ca
About 1,000 hours of work a day.
For two weeks. Building SchoolStats.ca.
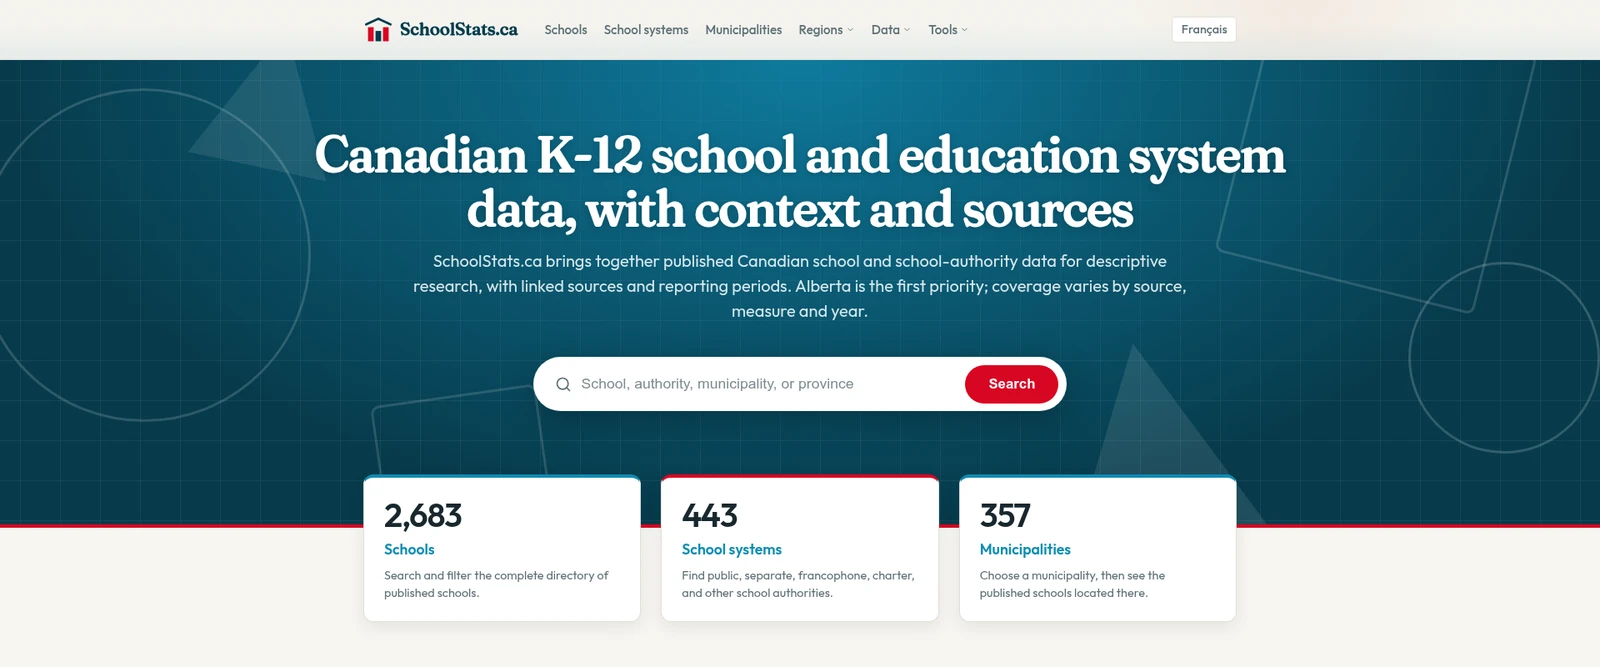
In short: For SchoolStats.ca, Keyhani reports roughly 150 hours of building over two weeks with parallel Replit agents and under $10K in AI tokens. An AI agent estimated about 15,000 hours of equivalent pre-AI effort and a multi-million-dollar conventional build. About 1,000 equivalent hours a day is rounded shorthand over those two weeks. The counterfactual effort and build-cost figures are AI-agent estimates, not independent quotes or an audited productivity benchmark. Token spend excludes founder time and other project costs.
Speaker narrative · cue: One frame. Compare about 15,000 estimated pre-AI hours with 150 hours of my time, then the multi-million-dollar conventional build estimate with under $10K in AI tokens. Explicitly attribute the counterfactual estimates to an AI agent. Keep the distinction between token spend and total project cost clear.
About a thousand hours of work a day. For two weeks. That is how I describe building SchoolStats.ca with parallel AI agents on Replit. I put in roughly one hundred and fifty hours with parallel agents. An AI agent estimated about fifteen thousand hours of equivalent pre-AI effort: roughly a thousand per day over two weeks. The agent also estimated a multi-million-dollar conventional project. My AI-token spend was under ten thousand dollars. These are counterfactual AI-agent estimates, rather than independent quotes or an audited benchmark. Token spend excludes my time and other costs. What matters to me is the change in what I can attempt. I could turn a substantial school-data project into working software while coordinating many workstreams. I still set direction, check the results and own the product. That experience is one reason I am trying more things. It also motivates the question behind the research: what changes when more experiments become affordable?
One draw versus the best of ten · Normal
Draw ten. Keep the best.
The distribution of the best outcome is a different distribution.
- Draw 10 independent outcomes; highlight the largest.
- Repeat the whole group. Keep one maximum each time.
In short: Standard Normal N(0,1), as in Figure 1. Compare individual draws with maxima of groups of ten: the maximum CDF is F(x)^10 and its density is 10 f(x) F(x)^9. The theoretical median moves from 0 to about 1.50. Histograms are simulations, not the paper’s original samples.
Speaker narrative · cue: Show one group, then reveal repeated groups and the maxima histogram. Explain that each amber observation represents ten attempts.
Make the paper's first graphic happen. Turquoise represents a standard Normal distribution: mean zero, standard deviation one. Draw ten outcomes; highlight the largest. The other nine attempts happened too. Repeat. Each amber observation is the maximum of a new group. These accumulate into a different distribution, shifted right. Lines show exact theoretical densities; bars show our seeded simulation. This is selection from unchanged opportunities, not evidence of learning. The median maximum is about one point five instead of zero. That required ten attempts; an individual group can still disappoint.
One draw versus the best of ten · Pareto
Sampling the tail.
Different attempts create exposure to rare outcomes.
- Pareto outcomes: minimum 1, tail shape 2.5.
- Best-of-n is exposure. Who can afford enough attempts?
In short: Sampling the tail means using genuinely different attempts to gain exposure to rare outcomes. In this Pareto illustration (minimum 1, shape 2.5), the theoretical median rises from 1.32 for one draw to 2.95 for the best of ten. The maximum CDF is F(x)^10; values beyond the linear 1–8 window stay counted. This is conditional exposure, not guaranteed entrepreneurial success. Every attempt uses time, money and attention. The runway scene returns to who can afford to keep sampling.
Speaker narrative · cue: Name sampling the tail as a conditional entrepreneurial strategy. Plant the question: who can afford to keep taking draws? Return to it in the runway scene.
Repeat the operation with the paper's Pareto: minimum one, shape two point five. These are the figure's parameters, not the median-matched settings used next. Take ten independent draws; retain the maximum; repeat. Many results cluster left, while some groups reach far right. The display ends at eight, but observations beyond it remain counted. The median moves from about one point three two to two point nine five. This is sampling the tail: distinct experiments create exposure to rare outcomes, not guaranteed success. The same selection rule applies to Normal and Pareto. But ten attempts cost time, money and attention. Who gets enough chances to keep sampling? Hold that question until we return to founder runway.
The probability distribution of your best outcome
More distinct attempts, more exposure.
Increase exposure. Count the cost.
- Take n independent attempts. Keep the best.
- Watch the distribution shift as n increases from 1 to 40.
In short: A fixed blue best-of-1 Pareto curve provides a baseline while a yellow maximum-distribution curve changes as the number of independent attempts increases from 1 to 40. Only n and the yellow curve geometry change during playback. The underlying distribution, axis limits and density scale remain fixed. The model uses median 1, minimum 2^(−1/α), and selected tail shape α. The maximum CDF is F(x)^n; log-outcome density includes the logarithmic Jacobian. The finite logarithmic display ends at 1000, with its continuing tail disclosed and no renormalization. This is an analytic distribution, not a random sample or a promise that a particular portfolio hits. The original seeded sampling comparison remains available in exploration.
Speaker narrative · cue: One frame, two minutes. The blue best-of-1 baseline stays fixed while the yellow best-of-n curve advances from 1 to 40 on the same axes. Pause or replay as useful. Explain possible portfolio maxima, then connect broader tail exposure to cost and survival.
Start at one attempt. The blue baseline stays fixed. The yellow curve describes possible outcomes across many hypothetical portfolios as we increase the number of independent attempts. At each value of n, keep only the best outcome. Watch the curve shift toward larger outcomes as n rises to forty. The axes stay fixed throughout, so the movement reflects the distribution itself. There are no individual draws or selected winners in this picture. We use median-one Pareto outcomes and the displayed tail shape. The horizontal axis is logarithmic; density is measured per log-ten outcome. The tail continues beyond the finite plotting window. These are exact theoretical curves. More attempts improve exposure to the tail. They also cost resources. No finite portfolio guarantees a threshold hit. For independent attempts, the chance of at least one hit is one minus the chance every attempt misses; equal single-attempt hit odds and attempt counts give the same probability across distributions. The next questions are empirical and practical: does this mechanism fit observed entrepreneurship, are our bets genuinely different, and can one founder afford to keep trying?
Kickstarter · one creator’s best campaign
More chances explain much.
What if repeat creators got more draws?
- Benchmark: one-time creators’ pledged amounts.
- Compare each repeat creator’s best campaign.
In short: Filtered U.S. Kickstarter campaigns, 2009–2017; outcome: amount pledged, not profit or funding-goal success. Share whose best campaign beats the one-time creators’ 90th percentile, model versus observed: 2 projects 19% versus 18.1%; 3 projects 27.1% versus 27.1%; 4 projects 34.4% versus approximately 34%; 5 projects 41.0% versus approximately 39%. Four- and five-project model rates use 1−0.9^n; their observed rates are approximate readings reconstructed from Figure 5’s model-minus-observed discrepancy plot, rounded to whole percentages, not tabulated values. At the 95th and 99th percentiles, observed outliers exceed predictions. Compatible with exposure benefits, not causal proof against learning.
Speaker narrative · cue: Single frame: both explanatory points remain visible while the bar chart animates once. Explain the baseline, then compare all four creator groups. The last two observed rates are approximate chart readings. Finish with the higher-cutoff caveat.
Jamshidi's thesis makes the design clear. In filtered U.S. Kickstarter campaigns from 2009 through 2017, the outcome is dollars pledged. Start with the distribution among creators who launched one project. Ask what repeat creators' best campaigns would look like if they simply took more independent draws from that same distribution, without learning. Compare each repeat creator's maximum with the one-time creators' top-ten-percent cutoff. For two projects, the model predicts nineteen percent; eighteen point one percent are observed. For three, both figures are twenty-seven point one percent. For four, the model predicts thirty-four point four percent; for five, forty-one percent. Observed rates are approximately thirty-four and thirty-nine percent, reconstructed from the published discrepancy chart and rounded. They are not exact tabulated statistics. The extra-chances model comes close. Agreement does not prove learning is absent. At the ninety-fifth and ninety-ninth percentile cutoffs, observed outliers exceed model predictions. The thesis suggests learning may matter especially for these exceptional outcomes. This observational comparison cannot separate learning from selection or other differences among creators. Recognize exposure as a useful benchmark, not a complete explanation.
Uncorrelated search · correlated focus
Explore or exploit? Read the landscape.
Different landscapes reward different patterns of bets.
- Spread bets to search; cluster bets around a shared lead.
- The value of focus depends on the landscape and the evidence.
In short: A 2×2 simulation compares independent global proposals with shared-lead clustered proposals. Both receive the same imperfect prior lead and 20 equal-cost tests; their coordinate sequences are reused across rows. The top terrain has eight dispersed high-value pockets and a weak central pocket. The bottom has two compact, centrally arranged clusters, replacing the former oversized basin. Discoveries count distinct dominant pockets reached at score 0.20 or higher; repeat visits count once. Dashed rings identify discovered pockets. Accumulated value separately sums all test scores, including repeat returns. Broad search is useful for discovering scattered opportunities; focus is useful for earning repeat value near a useful lead. These are constructed conditions with different opportunity counts and total reward areas, rather than a controlled causal test of correlation alone. Topography is shown only to the audience. No seed or winner is selected. The manuscript’s common-shock model remains a separate exploration tool.
Speaker narrative · cue: One frame, four synchronized simulations. On the left compare discoveries in dispersed pockets versus two compact clusters. On the right compare repeat value around the same prior lead. Distinguish distinct discoveries from accumulated value. These constructed environments vary opportunity count and area; individual runs can differ from the typical pattern.
Read the columns first. Independent proposals search across the opportunity space. Correlated proposals make nearby variations around one shared lead. Both strategies receive that lead and twenty equal-cost tests. Both rows reuse their proposals. The top landscape has scattered opportunities around a weak initial lead. Broad search can discover several different pockets. Concentrated search revisits one neighborhood. The bottom landscape has two compact clusters near the lead. Nearby variations can repeatedly capture value. The useful region is small, so random global search can miss it. Watch discoveries and value separately. A discovery is a distinct pocket reached at a score of at least point two; repeats count once. Value sums all scores, assuming refinements can produce repeat returns. Both terrains are centered. They deliberately differ in opportunity count and area. This illustrates specified environments, rather than isolating correlation’s causal effect. The audience sees the surface; the policies receive only the lead. Outcomes vary across seeds. Correlation here means related proposals around a shared, imperfect lead. It is distinct from the manuscript’s common-shock probability model, retained in exploration. Match the pattern of bets to the landscape and what you know.
The conditions for experimentation
When do more small bets make sense?
GenAI shifts the cost of trying; markets still set the opportunity.
- Fit the number of bets to the conditions.
- GenAI can make smaller software tests affordable.
In short: More small experiments make sense when rare large payoffs are possible, credible tests are affordable, bets differ meaningfully, early signals are noisy, and losses are small and reversible. Fewer, deeper tests fit tightly bounded upside, expensive evidence, shared premises, clear signals worth pursuing, or large irreversible commitments. GenAI can lower the implementation cost of some software experiments and reduce the build commitment needed to try them. The diagram illustrates that qualitative shift; it assigns no scores, optimal trial counts or measured productivity multipliers. Market upside, independence and evidence quality remain case-dependent. A useful test still needs customer access, safe delivery, observable evidence and follow-through.
- UpsideUpside is tightly boundedA rare hit could cover many misses
- Cost of a real testCredible evidence is expensiveCredible tests are affordableGenAI · Can lower the build cost
- DistinctnessShared assumptions and channelsDifferent problems, audiences and channels
- Early evidenceClear signals favor deepeningNoisy signals favor trying alternatives
- DownsideLarge, hard-to-reverse commitmentsSmall, reversible stakesGenAI · Can shrink the build commitment
GenAI can lower software build costs and commitments. Upside, distinctness and signal quality stay market-dependent.
Real tests still need customer access, safe delivery and capacity to follow through.
Speaker narrative · cue: 60s. Compare the conditions for fewer/deeper versus more/smaller tests. Let the GenAI shift highlight build cost and build commitment only. Explain why market upside, distinctness and signal quality stay conditional. Next distinguish new capabilities from cheaper implementation.
This is the decision after the simulations. More experimentation is a conditional strategy. Favor more small tests when rare large payoffs could cover misses, credible tests are affordable, the bets are genuinely different, early signals are noisy, and losses are small and reversible. Favor fewer, deeper tests when upside is tightly bounded, useful evidence is expensive, proposals share one fragile premise, clear signals point toward something promising, or mistakes create hard-to-reverse losses. Both approaches can generate learning. GenAI’s shift is specific. It can reduce the implementation cost of some software tests and shrink the commitment needed to build them. That moves affordability and build stakes toward the more-experimentation conditions. Upside, independence and signal quality remain questions about the market. Cheap prototypes become meaningful experiments when they test an offer or behavior with real people and observable evidence. Customer access, safe delivery and capacity to follow through still matter. Use informative evidence to deepen a promising direction. The arrows are qualitative. They describe a possible change in feasibility, without predicting an optimal number of ventures. This helps explain my portfolio. First, consider what new kinds of software we can build.
New capabilities · beyond cheaper code
Judgment-powered software.
Keep calculation exact. Adapt the explanation.
- Rules give the same correct calculation every time.
- LLMs adapt how that answer is explained to a learner.
In short: A calculator applies exact rules: 2 × 2 should always equal 4. An LLM can adapt how that answer is explained to a five-year-old without requiring a separately programmed lesson for each new request. Rules-based educational software can already deliver lessons built for it; the new opportunity is flexible interpretation and adaptation across contexts. Combine the capabilities: the LLM calls a calculator for arithmetic and shapes a child-friendly explanation around the result. Judgment remains fallible, with outputs to check and people accountable for consequential decisions. The illustration is a metaphor and the comparison is a teaching example.

One answer. Two kinds of software.
2 × 2 = 4
Compute 2 × 2. Get 4, every time.
Fixed rules are exactly what this task needs.
“Explain 2 × 2 so my five-year-old can learn.”
Adapt to the learner without a custom-coded lesson for every new request.
Use both togetherLLM → calculator → 4 → child-friendly explanation
OpportunityAutomate parts of workflows whose inputs resist a complete rulebook.
BoundaryLLM judgment is fallible. Check outputs and retain human responsibility.
Speaker narrative · cue: 60s. Contrast calculating 2 × 2 with explaining it to a five-year-old. Trace the calculator tool flow. Emphasize adapting the explanation while keeping the answer fixed. Preserve the opportunity and boundary, then transition to harnesses.
GenAI changes what software can do, as well as what it costs to build. A calculator should always give the same answer to two times two: four. That consistency is exactly what we want. I am not asking a language model for its opinion about arithmetic. If the task involves a calculation, let the model use a calculator as a tool. Now change the request: explain two times two in a way that helps my five-year-old learn. The answer stays four; the explanation must fit the learner. Two pairs of apples might help. Rules-based educational software can deliver lessons a developer has designed. The difference is generality: an LLM can adapt to a new learner or request without a separately programmed lesson for every case. This is judgment-powered software: flexible, fallible interpretation. Keep exact operations in code, check the explanation, and retain human responsibility. The harness brings these capabilities together.
Where I see the opportunity
What harness will you build?
Compose rules and judgment around a valuable task.
- Code sets permissions and checks outputs.
- Other models can classify or critique; people handle consequential exceptions.
In short: A harness is the surrounding system of context, tools, permissions, workflow logic, output checks and escalation. Three illustrative compositions: an agent chooses among code-enforced tools; a rules-owned invoice workflow calls an LLM at a defined step and checks its output; and monthly-close rules contain an investigating agent, a read-only ledger tool and a classifier LLM. Another model can critique a proposal, while conventional code enforces hard constraints. Model checks can share errors, so evaluation and appropriate human approval remain necessary. The refund cap is an illustrative tool policy. These diagrams explain architecture patterns rather than a deployed product or a security guarantee.
AJudgment on top
- Look up orderRead only
- Issue refundEligibility check · ≤ $100
- Draft replySending disabled
Code validates inputs and enforces each tool’s limits.
BRules on top
- Rules: Select the next invoice
- Model: Match invoice to purchase order
- Rules: Check totals and vendor
- Rules: Escalate exceptions to a person
The workflow owns the sequence and checks the model’s output.
CNesting
Rules and model calls can sit inside one another. Other models can classify or critique; their checks remain fallible.
Use code for hard limits, models for interpretation, and people for consequential exceptions.
Speaker narrative · cue: 75s, about 25s per frame. Frame 1 highlights A: judgment on top and tool limits. Advance to highlight B: rules on top and invoice checks. Advance again to highlight C: nesting and the inner classifier. Other panels stay visible for comparison. Close by asking which bounded, valuable workflow deserves a harness, then show your projects.
The product opportunity I see is the harness: context, tool access, output checks and exception handling around the model. Three compositions. Judgment on top lets an agent choose tools and sequence; conventional code enforces each tool’s limits. Rules on top keeps the invoice workflow in charge, calling the model at a defined step and checking its output. Nesting combines both: monthly-close rules contain an investigating agent, a read-only ledger tool and a classifier model. Another model can critique a proposal; its checks can share errors. Test the whole system. Retain human approval for consequential actions. Now, my own projects.
My work · Selected software projects
Why I’m building a portfolio.
More affordable ways to find out.
- Honeybee Logic · AI for schools
- CheckIt.so · document review
- HelperBat · coordination by email
- AIScholar.cc · studying LLM behavior
- SchoolStats.ca · usable school data
- AIs Roast Humans · reader attention
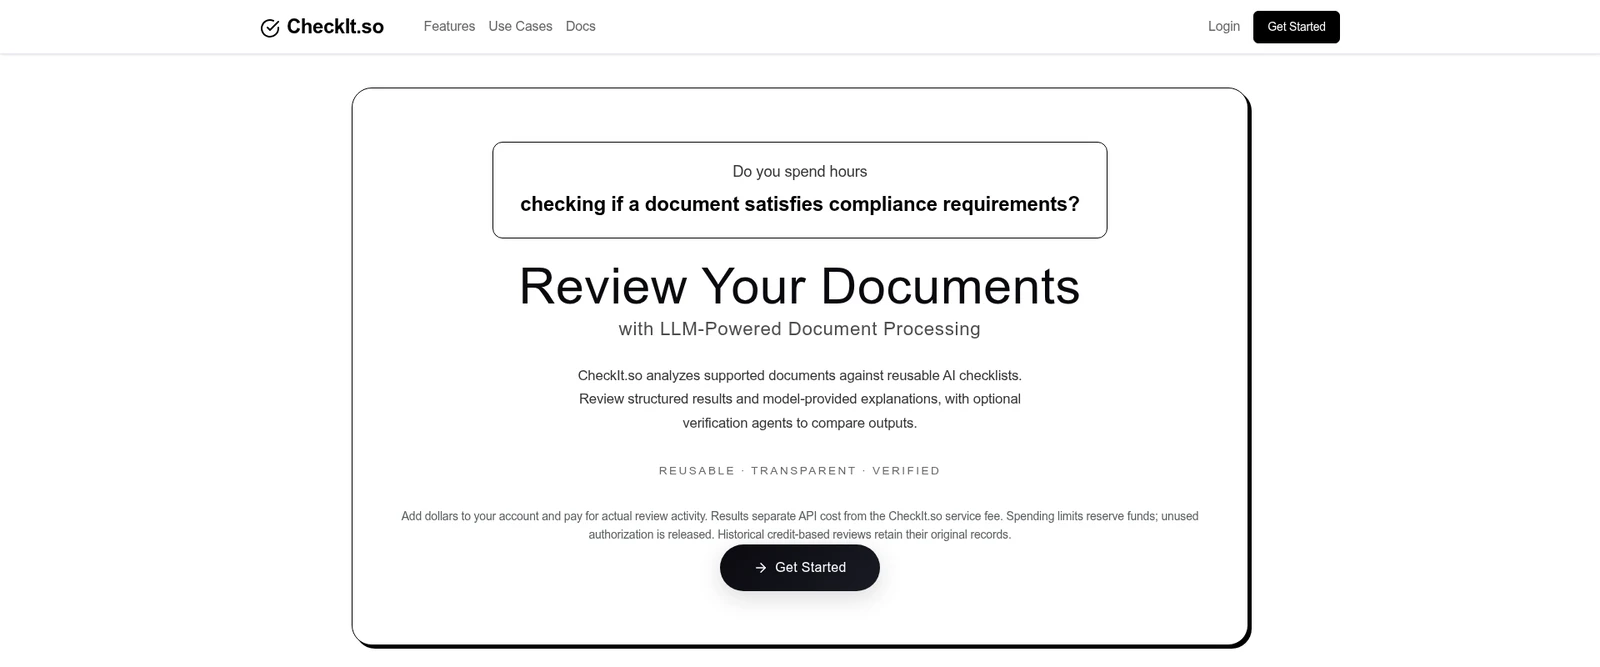
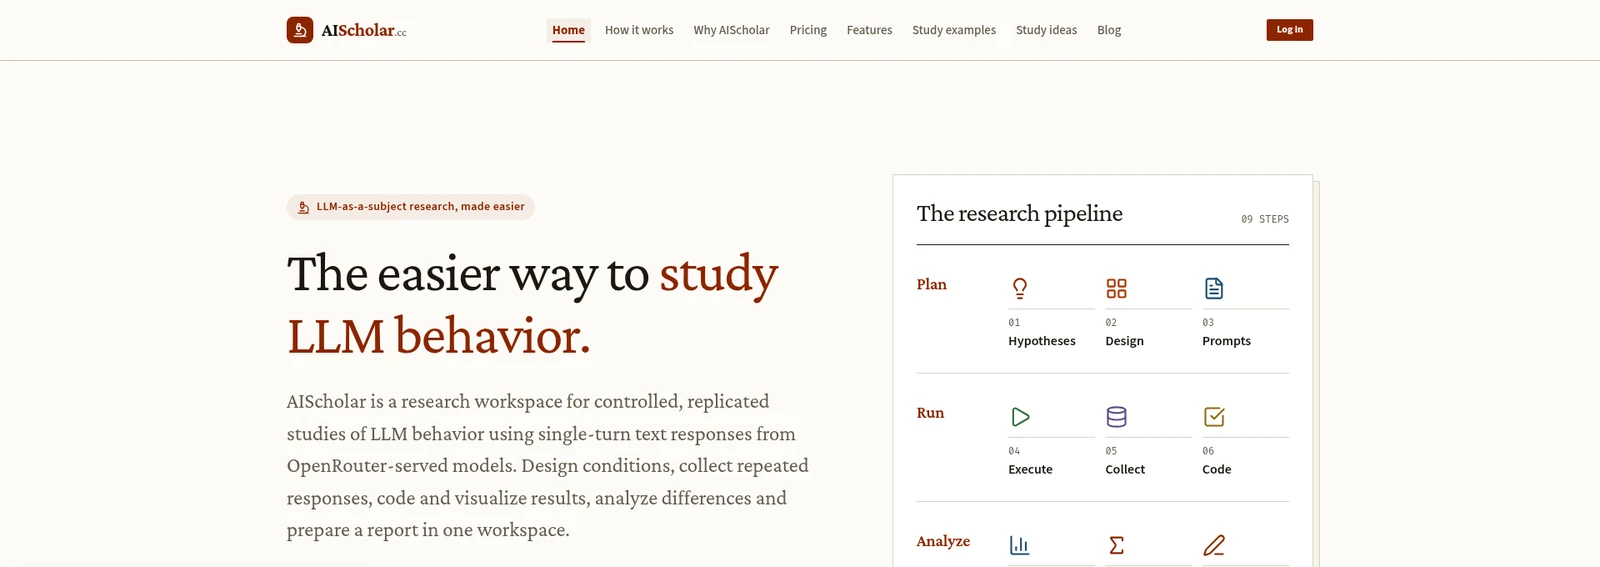
In short: Six current projects: Honeybee Logic—AI lesson planning deployed in Alberta schools; CheckIt.so—document review; HelperBat—email coordination; AIScholar.cc—systematic studies of LLM behavior; SchoolStats.ca—aggregated school data for education research; AIs Roast Humans—a free-to-read AI publication. Advance through six dedicated landing-page views with project-specific QR codes. The images are saved homepage snapshots, not live demos. GenAI lowers build friction, but users and routes to demand differ. The publication tests readership, not proven willingness to pay. Shared platforms, research networks and founder attention mean these are not independent draws. Proposed evidence tests are distinct from any dated deployment claims. Bound effort and decide whether to stop, change or deepen on evidence; the mix is not proof of an optimal portfolio.
Real projects · what GenAI enables
- Honeybee Logic · Company · deployed in Alberta. Schools · curriculum-aware lesson planning. What GenAI enables: Draft curriculum-aware lesson plans for each teacher’s context, beyond fixed templates.
- CheckIt.so · Document AI · launched 2025. Teams · repetitive document review. What GenAI enables: Interpret document meaning for structured reviews, beyond keyword matching and fixed extraction rules.
- HelperBat · AI scheduling assistant. Busy teams · email coordination. What GenAI enables: Interpret requests and replies in email, turning conversational context into scheduling actions.
- AIScholar.cc · Research platform. Researchers · systematic studies of LLM behavior. What GenAI enables: Study LLMs as experimental subjects, automating comparisons of their responses and behavior.
- SchoolStats.ca · SSHRC-supported data project. Education research · fragmented school data. What GenAI enables: Parallel AI agents made a data-intensive research platform feasible for me to build.
- AIs Roast Humans · Free-to-read AI publication. Readers · satire and model perspectives. What GenAI enables: Publish model-authored satire and commentary, comparing different AI perspectives on the same subject.
For each test: cap effort in advance, preserve maintenance and attention, and decide whether to stop, change, or deepen based on what customers actually do.
Project01/ 06
Honeybee Logic
Company · deployed in Alberta
- For
- Schools · curriculum-aware lesson planning
- What GenAI enables
- Draft curriculum-aware lesson plans for each teacher’s context, beyond fixed templates.

Project02/ 06
CheckIt.so
Document AI · launched 2025
- For
- Teams · repetitive document review
- What GenAI enables
- Interpret document meaning for structured reviews, beyond keyword matching and fixed extraction rules.
Project03/ 06
HelperBat
AI scheduling assistant
- For
- Busy teams · email coordination
- What GenAI enables
- Interpret requests and replies in email, turning conversational context into scheduling actions.

Project04/ 06
AIScholar.cc
Research platform
- For
- Researchers · systematic studies of LLM behavior
- What GenAI enables
- Study LLMs as experimental subjects, automating comparisons of their responses and behavior.
Project05/ 06
SchoolStats.ca
SSHRC-supported data project
- For
- Education research · fragmented school data
- What GenAI enables
- Parallel AI agents made a data-intensive research platform feasible for me to build.
Project06/ 06
AIs Roast Humans
Free-to-read AI publication
- For
- Readers · satire and model perspectives
- What GenAI enables
- Publish model-authored satire and commentary, comparing different AI perspectives on the same subject.

Speaker narrative · cue: Spend about 18 seconds on the six-project overview, then 22 seconds on each landing-page view. Explain its GenAI-enablement panel and connect it to the harness discussion. Distinguish embedded AI capabilities from AI-assisted construction at SchoolStats. QR codes open the respective homepages.
Here is how I am trying to apply the argument. GenAI lowers the barrier to building things I can put in front of people. It does not tell me which will matter. Start with Honeybee Logic: an operating company, not a disposable prototype. My Building page reports deployment in more than a dozen Alberta schools as of September 2026, plus paid custom development. For a partner or investor, the question becomes whether schools keep using it and expand. GenAI enables Honeybee to draft lesson plans for a teacher’s curriculum and context, going beyond a fixed template library. CheckIt uses model interpretation for structured document review. HelperBat interprets natural-language email requests and replies for scheduling. These workflows involve meaning and context that are awkward to specify as exhaustive rules. AIScholar makes LLM behavior itself the subject of automated research. SchoolStats is a different kind of enablement: parallel AI agents made a data-intensive platform feasible for me to build. That is a construction story, rather than a claim that its data product requires an LLM to operate. AIs Roast Humans is a free-to-read publication of model-authored satire and commentary. Different models provide contrasting perspectives on the same subject. Its commercial demand remains something to investigate. Why this mix? Different users, workflows and distribution channels expose different assumptions. GenAI makes more of these attempts feasible; it does not create their demand. The displayed evidence tests are proposals, not reported results. I still need bounded effort, affordable misses, maintenance capacity and permission to stop, change or deepen. These are not independent draws. AI platforms, my network and attention are shared. Nor do I have Levels's or Vassallo's distribution. The research's conditions are requirements to work toward, not credentials earned by listing product names. For an explicitly hypothetical Alberta parallel, test a maintenance-handoff tool with one consenting contractor, non-sensitive records and manual review before integrations. Partners and investors should ask what changed because of customer evidence.
The end
Key takeaways
What was useful? What could be clearer?
In short: Three takeaways: Assess the opportunity landscape. Be deliberate about experimentation strategy. Build previously impossible software and rethink all legacy systems for the GenAI era. Give Mohammad feedback at https://mohammadkeyhani.com/feedback/ using the large QR. The smaller QR keeps this interactive deck and its references accessible.
- Assess the opportunity landscape
- Be deliberate about experimentation strategy
- Build previously impossible software and rethink all legacy systems for the GenAI era

Speaker narrative · cue: Recap the opportunity landscape, deliberate experimentation and new software/rethinking legacy systems. Invite feedback using the large QR at mohammadkeyhani.com/feedback/. Point to the smaller QR for the deck and references. Leave both codes and all three takeaways visible for the final pause.
Return to your opening idea. Here are my three takeaways. 1. Assess the opportunity landscape. 2. Be deliberate about experimentation strategy. 3. Build previously impossible software and rethink all legacy systems for the GenAI era. Fit your strategy to the landscape. Look beyond cheaper implementation to the new capabilities GenAI makes possible. I’d love your feedback on what was useful and what needs a clearer explanation. The large QR opens mohammadkeyhani.com/feedback/. The smaller QR opens this deck and its references. Thank you.
Models & assumptions
Judgment-powered software: A teaching contrast between exact calculation and adapting an explanation to a learner. Rules-based educational software can deliver predesigned lessons; LLMs can generalize across new requests without a bespoke lesson for each. A calculator tool provides the arithmetic result; model interpretation and explanations still need checking. Earlier software also used statistical inference. The illustration is a metaphor; the arithmetic/teaching comparison and three architectures are illustrative, with no model calls or deployed integrations.
A harness can combine context, model instructions, tools, permissions, validation, monitoring and escalation. Conventional code can enforce specific permissions and limits. The example refund tool validates eligibility and an illustrative $100 ceiling. Invoice arithmetic and vendor checks stay in code; exceptions reach a person.
Another model may classify information or critique an output, but its errors can be correlated with the first model’s errors. Evaluate the whole system, test failure paths, log actions and retain appropriate human approval. These diagrams show composition patterns rather than a correctness, security or autonomy guarantee.
Qualitative decision guide: Compare payoff upside, the cost of obtaining credible evidence, dependence between bets, information in early signals and downside reversibility. These are conditional guides rather than a scored model or a rule for choosing an optimal number of ventures.
The two arrows illustrate how GenAI can reduce software implementation costs and build commitment. They show a qualitative possibility rather than measured before-and-after values. Customer access, validation, safe delivery, operating costs and follow-through remain part of the whole experiment.
The other conditions stay market-dependent. Use strong evidence to deepen a direction; use affordable, distinct tests when early evidence leaves real uncertainty. Broad experimentation and learning can complement each other. This is a conceptual application of the experimentation mechanisms and boundary conditions discussed in the cited research, including the supplied manuscripts; it is not a validated GenAI forecast.
Project pages: Six local landing-page snapshots captured November 15, 2026 show the top section of each real homepage, cropped above cookie notices where necessary. They are not live websites or product demonstrations; screenshot copy reflects the capture date, not independently validated performance. Each QR encodes that project’s public homepage URL, also shown as a normal link. Images and QR codes are preloaded when the keynote opens; following a link or QR requires internet access.
Best-of-ten figure comparisons: Standard Normal N(0,1) and Pareto with minimum 1, shape 2.5, matching the parameter choices in Figures 1–2 of Keyhani & Jamshidi (2025). These are separate from the median-1 calibration below. Choose 1–1,000 independent batches on screen; the default is 20 batches of ten draws. The second frame reveals individual draws and briefly holds each completed batch’s maximum. A maximum enters the histogram only after all ten draws are revealed. At high batch counts or speeds, rendering may combine draws; all observations remain in the calculations. Changing the batch count changes the simulated histograms, while the theoretical best-of-ten law stays fixed. For continuous independent identical draws, F_max(x)=F(x)^10 and f_max(x)=10 f(x) F(x)^9. Lines are exact theoretical densities, not fitted GEV curves; bars use new seeded samples, not the paper’s original data. Baseline and maxima histograms use their own sample counts and bin widths as density denominators. Display windows are linear −4 to 4 and 1 to 8; off-window observations are retained and counted without renormalizing visible bins. More attempts cost resources and never guarantee demand.
Sampling: Normal median/mean 1, standard deviation 0.5; Pareto minimum 2^(−1/α), median 1. Common median does not imply equal variance. At α ≤ 1 the Pareto population mean does not exist; at α ≤ 2 its variance does not exist. Reported maxima describe finite samples, not population averages. Outcomes are illustrative units, not startup forecasts.
Reading the theater: Turquoise bars are empirical bin counts; the dashed curve is theoretical bin probability × draws shown. Height is count per bin, not density per outcome unit. Bins are equal-width on the displayed axis (logarithmic for Pareto). Each draw is computed individually; animation may reveal several draws per frame. Up to five recent sampling trails are rendered. Full outcomes, including overflow, remain in the calculations.
Threshold odds: q = P(X ≥ 5) from the selected distribution. P(at least one hit) = 1 − (1 − q)^n for independent identical trials. Equal q and n give identical hit odds across distributions. Additional attempts cost resources and generally give diminishing probability increments, not certainty.
Maximum distributions: Independent median-1 Pareto outcomes have minimum xₘ = 2^(−1/α). For the maximum of n draws, Fₘₐₓ(x) = F(x)^n and fₘₐₓ(x) = n f(x) F(x)^(n−1). The plotted density is with respect to z = log₁₀(x), so g(z) = ln(10) · x · fₘₐₓ(x). Stage playback shows exact distributions, with no sampled maxima or histogram.
Best-of-n curve playback: The stage shows a yellow analytic maximum-distribution curve against a fixed blue best-of-1 baseline, with integer n increasing from 1 to 40 and brief endpoint holds. Both axes and all other content are fixed during playback. The log-density is bounded above by α·ln(10) for every n≥1, so one analytic y-axis bound covers all 40 curves without per-frame autoscaling. The finite display window is not renormalized; probability beyond 1000 is at most 1−F(1000)^40 for this range of n. Pause, speed and replay affect only playback. Reduced motion shows n=40.
Dependence: P(hit) = (1 − ρ)[1 − (1 − q)^n] + ρq. Each of 24 simulated portfolios gets one mixture draw: independent Bernoulli trials with probability 1−ρ, otherwise a shared Bernoulli(q) realization for all 20 trials. ρ is this model’s common-shock parameter, not a universal payoff correlation. Each map shows the fixed first portfolio. The separately labelled repeated-portfolio estimate is noisy; the formula is the model probability.
Landscape rendering: Background shading samples the analytic surface on a 40×40 grid in seven brightness bands. Test scores use the continuous analytic surface at their actual locations. Brighter shading means higher illustrative value. The same scale is used in all four cells; no winner or favorable seed is selected. Dashed circles show the score≥0.20 contour of discovered peak components.
Opportunity landscapes: This constructed spatial model uses the unit square. Both fields are geometrically centered at (0.5,0.5), independently of proposal outcomes. A shared imperfect prior lead is uniform in [0.465,0.535]². Both policies receive it and 20 equal-cost tests. Independent proposals are uniform across the domain. Clustered proposals use Gaussian offsets with standard deviation 0.075 around that shared lead, reflected at boundaries. The exact proposal sequences are reused across rows. The dispersed terrain has a weak central peak (height 0.25, width 0.035) and eight peaks (heights 0.8–1, width 0.06) on a randomly rotated radius-0.30 ring. The concentrated terrain has two height-1, width-0.06 peaks at opposite radius-0.11 offsets on the same orientation. This replaces the earlier width-0.2 basin whose area made even random search productive. A test’s score is the maximum Gaussian peak value at its location. A distinct discovery is recorded when that score reaches 0.20, assigning the test to its highest-scoring peak; repeated discoveries of the same peak count once. Accumulated value sums every score, explicitly assuming additive repeat returns. Neither opportunity count nor integrated reward mass is matched across terrains: cross-row differences also reflect available opportunity area. This demonstrates conditional exploration/focus strategies in specified environments, rather than the isolated causal effect of payoff correlation. The audience sees the surface; policies receive only the prior lead. There is no adaptive learning, empirical calibration, forecast or optimal-strategy claim. Single runs vary. The manuscript’s common-shock model remains separate.
Reproducibility: Rehearsal seed 17112026. Replay repeats computed outcomes; speed and pause only affect animation. “New random run” explicitly chooses and displays a new seed. Reset restores rehearsal parameters. Presentation never advances itself. Core playback needs no external API, video, or media request after the page has loaded.
References & status
- Judgment-powered software and harness compositions · Conceptual teaching examples · Mohammad Keyhani
Three compositions recreated from the speaker’s supplied diagram: judgment on top, rules on top and nesting. Support/refund, invoice and ledger flows are illustrative; the $100 cap is an example tool policy. Judgment means fallible model-based interpretation. The contrast with explicit rules does not imply that earlier software never used statistical inference. Model reviewers can share errors; harnesses require evaluation, code-enforced permissions and appropriate human oversight. The supplied robot/apple illustration is a visual metaphor, served as an optimized local image.
- SchoolStats.ca build account and AI-agent estimates · Speaker-reported inputs · AI-agent counterfactual estimates
The speaker reports about 150 hours of building over roughly two weeks with parallel Replit agents and under $10K in AI tokens. He attributes the estimated 15,000 equivalent pre-AI hours and multi-million-dollar conventional build cost to an AI agent. The daily 1,000-hour figure is rounded shorthand. These estimates are not independently audited measurements or quotes. Token spend excludes founder time and other costs.
https://schoolstats.ca/ - Build in parallel · Replit documentation · Platform workflow documentation
Background on parallel tasks, isolated work and reviewing changes. Supports the workflow explanation, not the speaker’s time estimate or a productivity guarantee.
https://docs.replit.com/learn/build-in-parallel - Selected building projects · Mohammad Keyhani · First-person project context
Current project descriptions and roles; portfolio examples illustrate a research-informed design rationale, not independent trials or a claim of validated traction.
/building/ - Turning side projects into profitable startups · Pieter Levels · First-person account · January 24, 2018
Bootstrapping, launching side projects, and observing feedback. An influence on the research and the speaker’s approach, not causal evidence that copying the strategy reproduces the results.
https://levels.io/startups/ - Infinite Slop · Pieter Levels classroom example · Classroom visual supplied by Mohammad Keyhani
Composite of a product screenshot and two posts attributed to Levels. Keyhani describes an idea on August 29, 2026 followed by a build announcement a few hours later. Individual post timestamps and embedded technical performance claims were not independently verified. Illustrates implementation speed, not demand, revenue or a universal benchmark.
https://infiniteslop.ai/ - Small Bets · Community and educational resource · Daniel Vassallo
An influence on the speaker’s research and entrepreneurial approach. Practitioner experience complements, but does not replace, evidence or access to customers.
https://smallbets.com/ - Small Bets is joining Gumroad · Gumroad announcement · April 22, 2025 · Daniel Vassallo
First-party confirmation of Small Bets joining Gumroad. No acquisition price, membership totals, or follower-count comparison is needed for the argument.
https://gumroad.com/blog/p/small-bets-is-joining-gumroad - Random Experimentation and Exceptional Outcomes in Entrepreneurship · Published · Keyhani & Jamshidi · 2025 · Academy of Management Perspectives
Journal p. 7: model assumptions and limits. pp. 9–10: Kickstarter comparison at the 90th percentile; greater underprediction at higher cutoffs. Observational, not causal identification.
https://doi.org/10.5465/amp.2023.0514 - Three Essays on Entrepreneurial Experimentation under Heavy-Tailed Randomness · Doctoral thesis · Zahra Jamshidi · University of Calgary · November 2025
Chapter 3, §§3.4–3.6 and Figures 3.16–3.17: U.S. Kickstarter campaigns, 2009–2017; pledged amounts, the one-time-creator baseline, best-of-N comparisons, and greater observed outlier frequency than predicted at higher cutoffs. Used as explanatory context for the single Kickstarter slide; the numerical pairs above are cited to the published paper. The supplied thesis is not redistributed here.
- Extreme Value Experimentation Under Heavy Tails · Research manuscript · unpublished
Portfolio-level common-shock mixture and conditions involving dependence, low costs, weak signals and heavy tails. The keynote illustrates one mechanism, not the full Bayesian theory.
- The New Makers · GCEC virtual lecture, 2026 · Lecture materials · Mohammad Keyhani
Citizen development, technical co-founder dependencies, APIs, and human judgment.
- AI-powered entrepreneurship · University of Regina, 2026 · Lecture materials · Mohammad Keyhani
Building with AI versus AI-powered products; planning before code; responsible implementation.
- Related recording · CIrc_Dgw7-A · Further viewing
Optional lecture recording; not required for playback.
https://www.youtube.com/watch?v=CIrc_Dgw7-A - Related recording · mQ3z_yITDKY · Further viewing
Optional related recording; not required for playback.
https://www.youtube.com/watch?v=mQ3z_yITDKY

Share this experience
https://mohammadkeyhani.com/slides/vibe-coding-the-future/Simulations use a seeded pseudo-random generator (rehearsal seed 17112026). Windows: bell world linear −1 to 8; heavy tail log 0.1 to 1000. Off-window draws are counted and their true maxima reported.